Every now and then you may recognize them: Polardiagrams. May it be whilst reading one of the sailing magazines, may it be when browsing the high-glossy sales brochures of your favorite yacht-brand or whilst roaming the boat fairs and exhibitions (here´s an article on the last edition of Hamburg´s Hanseboot fair). Despite the fact that I would consider myself an educated person I am wondering and ask myself everytime again: How do I read such a Polardiagram, how is it made and what does it tell me as a skipper? I appreciate having found Peter Meyer, a well experienced Boatbuilder since more than 32 years in business, working as yacht-design consultant for the Giebelstadt-based German yacht brand Bavaria. He is willing to spend some of his precious time to go through this topic and answer all of my questions on polardiagrams.
The Art of the Yacht Designer
Advertisement
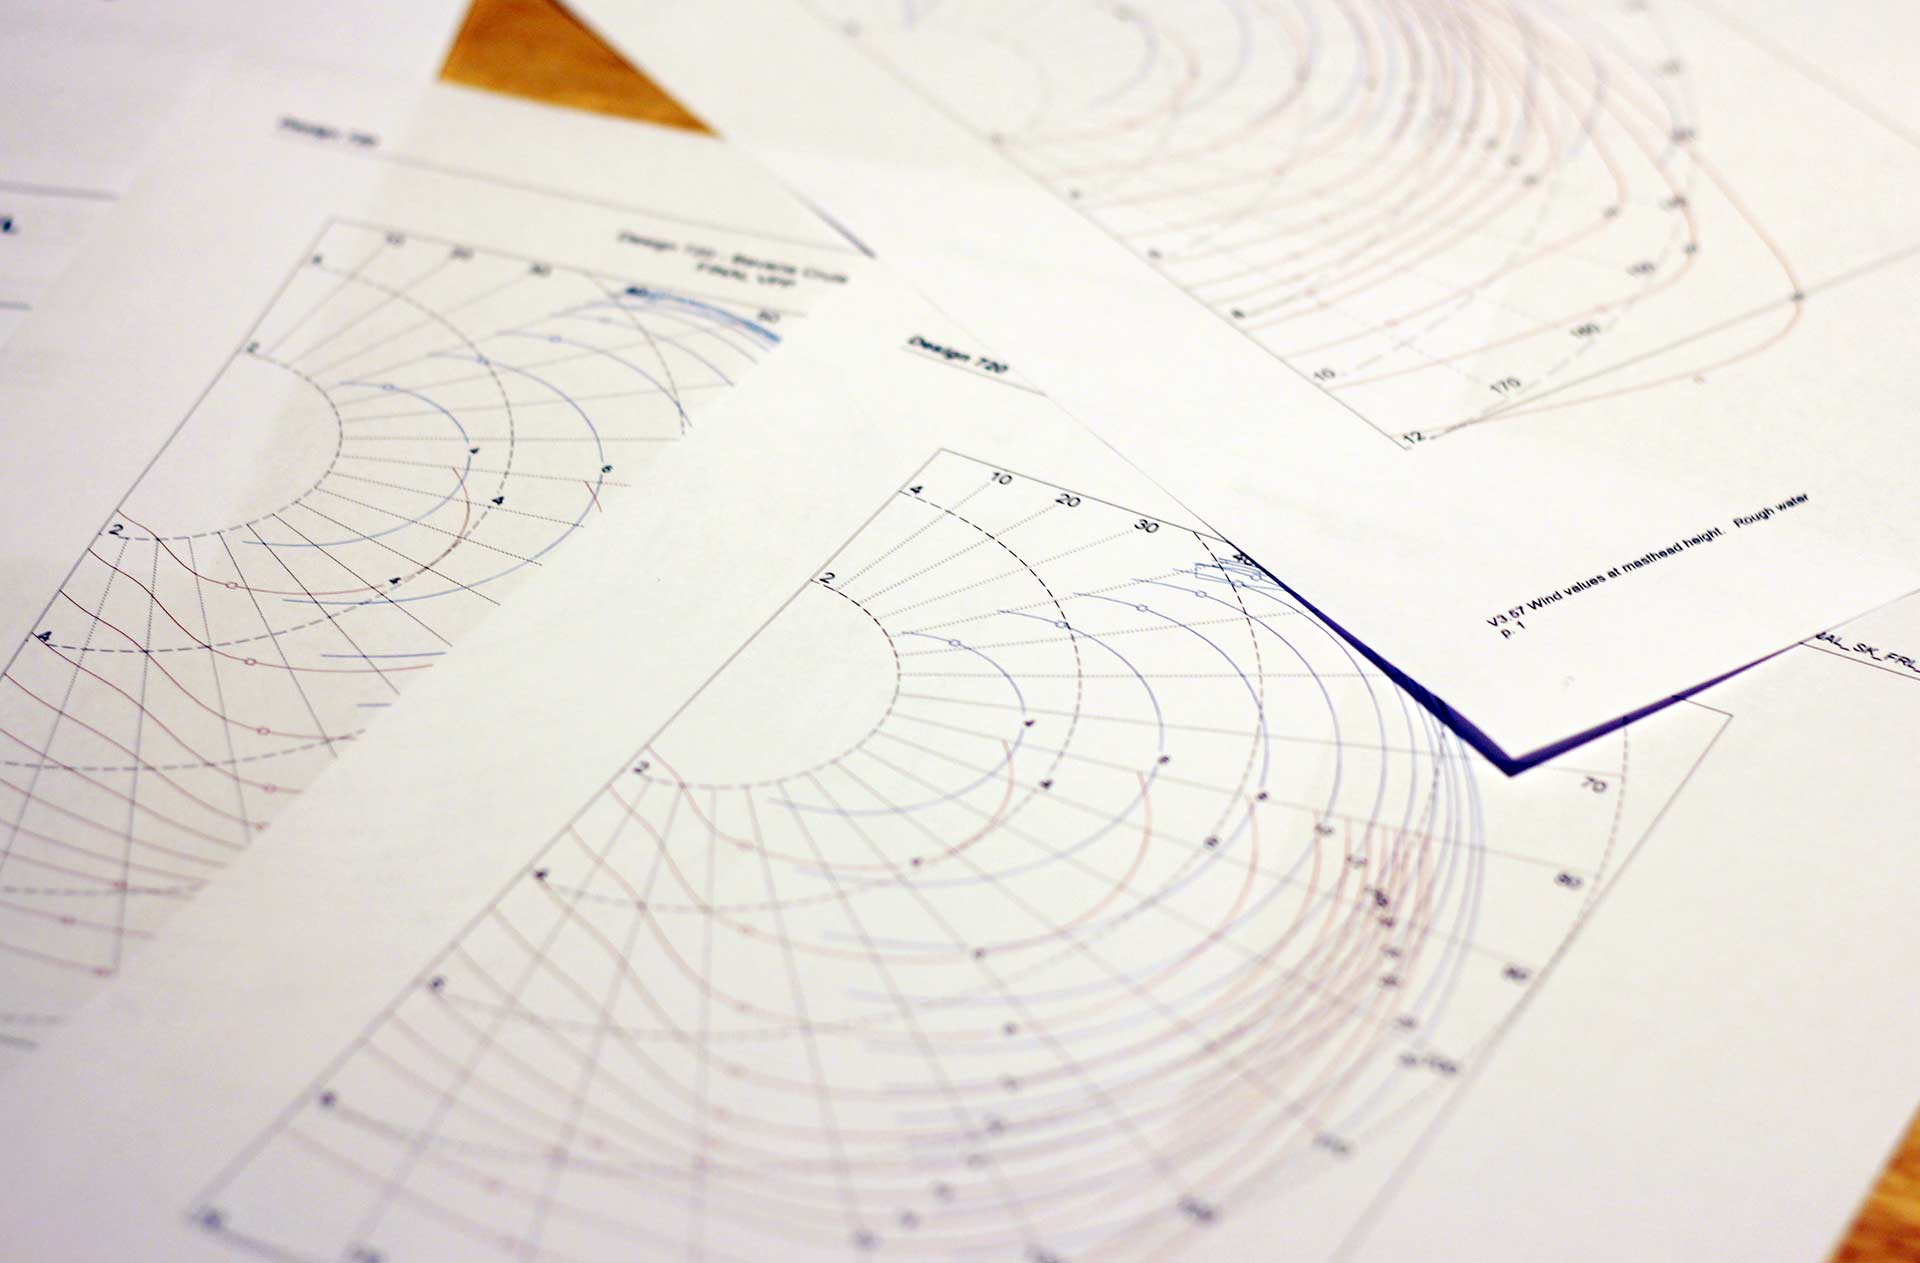
I find three PDF-documents in my inbox prior to our interview. “Go through them thoroughly, Lars”, he comments in his e-mail: “These are original VPPs by Farr Yacht Design of the Bavaria Cruiser 41. Every question you do have can be explained by looking at these data.” Bavaria has a multi-year long tradition in its partnership with the well-known design bureau Farr based in Annapolis, MAryland in the States where all of the yacht-designs are coming from. Peter Meyer is interconnected between the builder in Germany and the U.S. designers to match between the demand of the boat-builder for an efficient series manufacturing in assembly lines, the needs of the clients Bavaria wants to sell its product to and of course the wishes of the designers to reach for the best possible product.
Peter sent me original data by Farr Yacht Design/Bavaria Yachtbau Germany
“A VPP – which is an abbreviation for Velocity Performance Prediction – is the base of every single construction.”, Peter says at the start of our conversation. Capable computers with special construction-software do render every project and calculate through all hull designs, types of riggs and sail-configurations. It´s these data which allow the designers to optimize the form of the hull, vary the keel to the max and last but not least to design the best possible rig. “A yacht-designer of today utilizes the complex range of data and interprete the graphics to choose the final form and tune a yacht´s design. The polardiagram could be seen as a byproduct of this process.” So polardiagrams are first of all an essential part of the design- and construction-process of a yacht.
“Computers can calculate and simulate every single design imaginable. In principle I could go forward and render the data for a sailing bathtub if I wanted to.” With this digital aide the question of how a structural change may influence the sailing characteristics of a design can be answered. Can be answered very quickly. Towing experiments with a costly scale model or building much more costly prototypes are a thing of the past: “It gets even more exciting if you´d have to design a ship that has to meet certain input requirements. Such as it is the case with Bavaria yachts. It´s not really that hard to produce a fast sailing design. Not much effort needed here. Because fast means it will be hard driven, rumbling and very uncomfortable for the crew manning the ship. Which is, of course, second to thought only when it comes to high-performance sailing and regattas.” Clients of Bavaria, Cruiser owners in particular, are not interested in the tenth of a knot for their next Fastnet in the first place. “It gets complicated when a yacht should incorporate certain features or … a certain character. A cruiser – and Bavaria yachts are meant for cruising – should essentially be comfortable, should have the ability to move about on the high seas safely and should produce a safe feel for the crew on her. Of course, without sacrificing too much of her agility and speed in the end. And that´s the art of the yacht-designer.”
The Polardiagrams of the Bavaria Cruiser 41: Three Examples
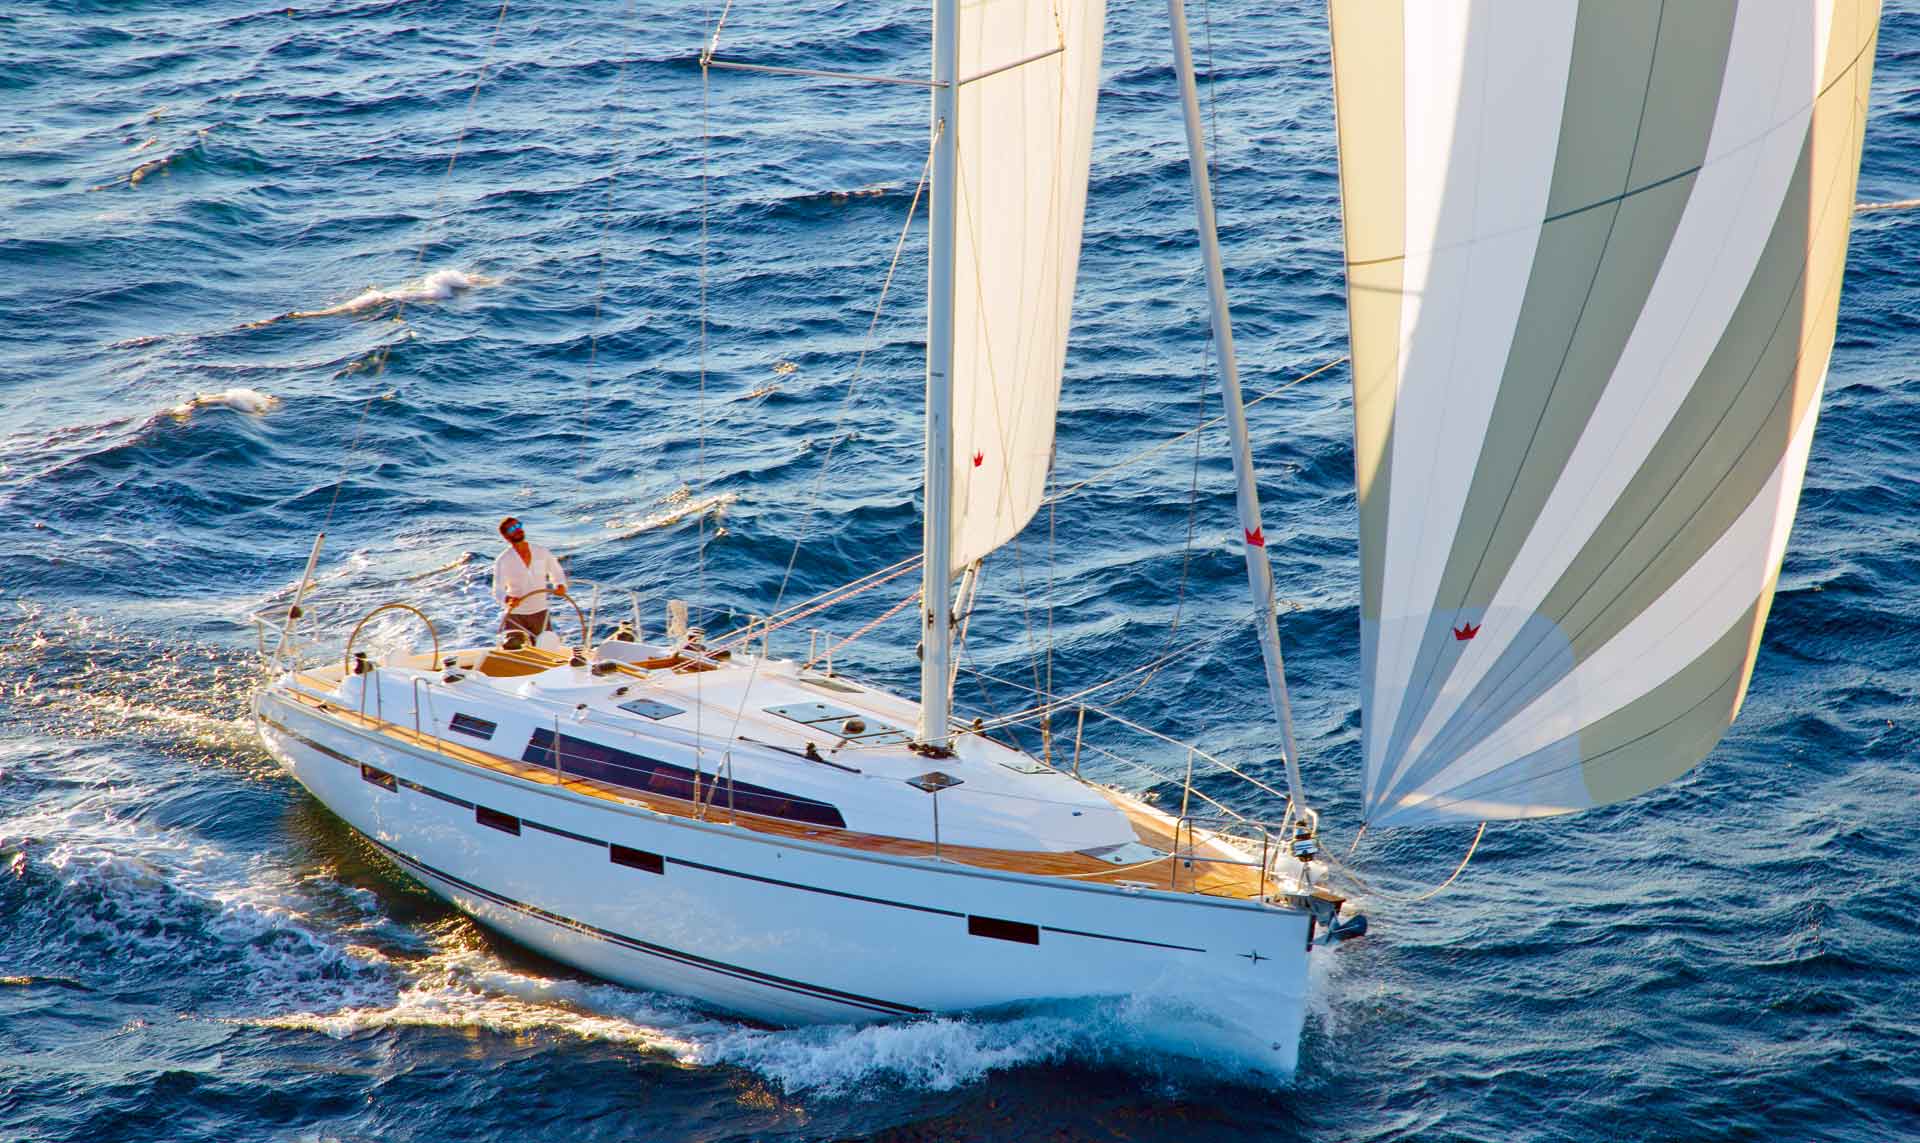
Why did Peter choose the Bavaria Cruiser 41 for our interview? “The C41 is the best example for that manner because Bavaria offers three variants of her – thus producing three different polardiagrams”, says Peter. I do put the Diagram of the Cruiser 41 SK to my left. “SK stands for Shoal Wing Keel”, Peter explains. That is the short version of the three keels offered. Next to it I do put the C41 DK. I make an educated guess: DK means Deep Bulb Keel, right? That´s a longer keel producing an even stronger crank of a lever. On the right I am placing the Polardiagram of the Cruiser 41S, the flagship and sporty version of the 41-range with the longest keel of them three. “I can assure you that these three yachts are in no way different from each other when it comes to the actual form of the hull. The exciting thing here is: They´re 100 per cent identical!” What makes the difference here, according to Peter, are the differing attachments: Rigging and keel.
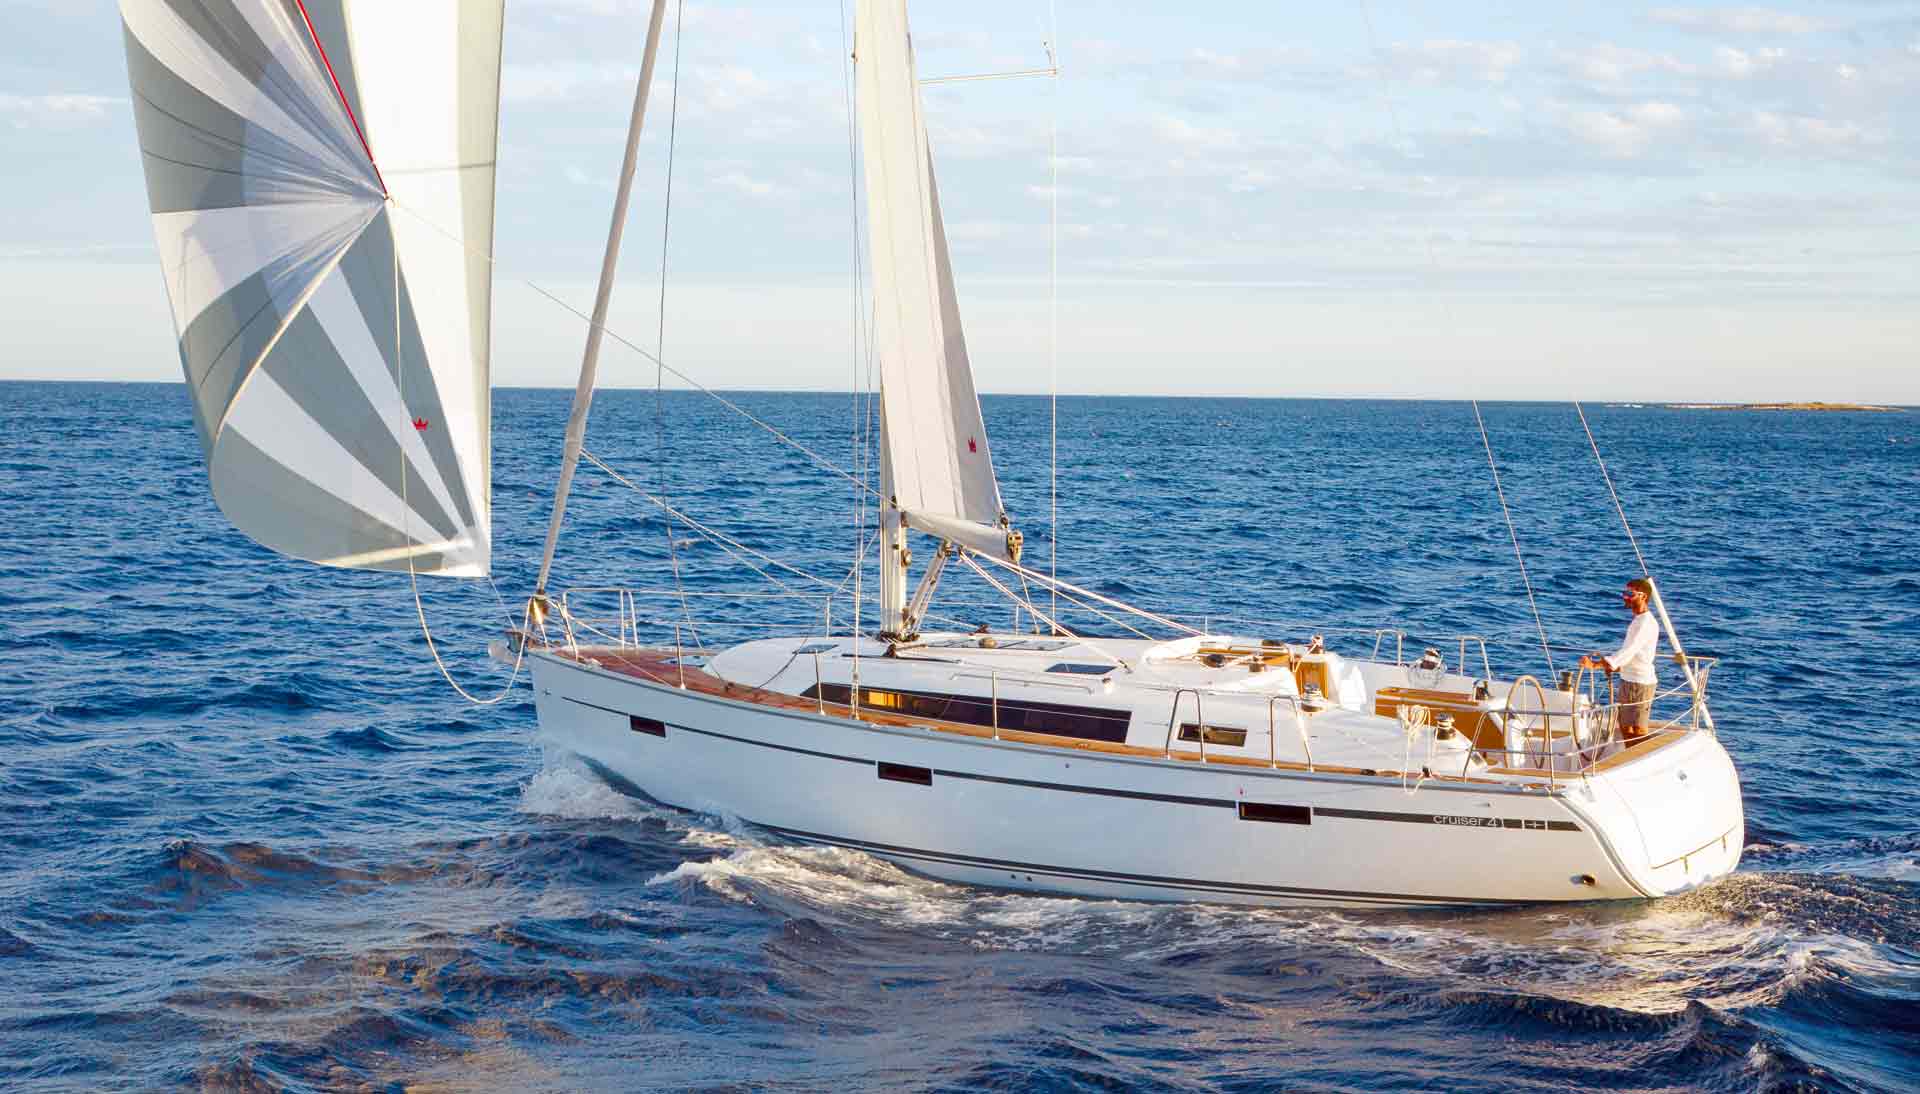
The beautiful Bavaria Cruiser 41
“The attachments are changing each boat in its character. Take the SK-variant. She has from a sailing perspective the weakest performance of the three – besides, “weak” is a very relative term here because all of them are sailing very nicely. But it´s main advantage is to be able to enter shallow marinas or moorings due to having a short keel. Clients may find that an important attribute.” The deep keel-variant, longer and thus creating more and more effective leverage, will enable the boat to be sailed much closer to the wind, but “as you may see very clearly when looking at the Polardiagram, the C 41S can be brought much, much closer upwind compared to the two other boats.”
So each construction has its very own advantages and disadvantages: “The C 41 SK is the perfect boat for the marina-hopper and mooring fan, maybe someone who travels the Caribbean of Pacific Ocean. An explorer if you want, searching for the hidden treasures of small anchoring places. With the C 41 DK you may be able to get more performance sailing-wise out of her for the price of not being able to let go anchors in every unknown bay. Which isn´t possible with the S and her long keel at all – but this boat has much more power and a real punch upwind on the other hand.” Okay, I begin to understand: This is where the benefit of a polardiagram lies for a skipper or more so future-skipper: One may be able to get an impression of the character and performance of a ship out of the graph. But how to read such a diagram?
What is a Polardiagram – and how to read it?
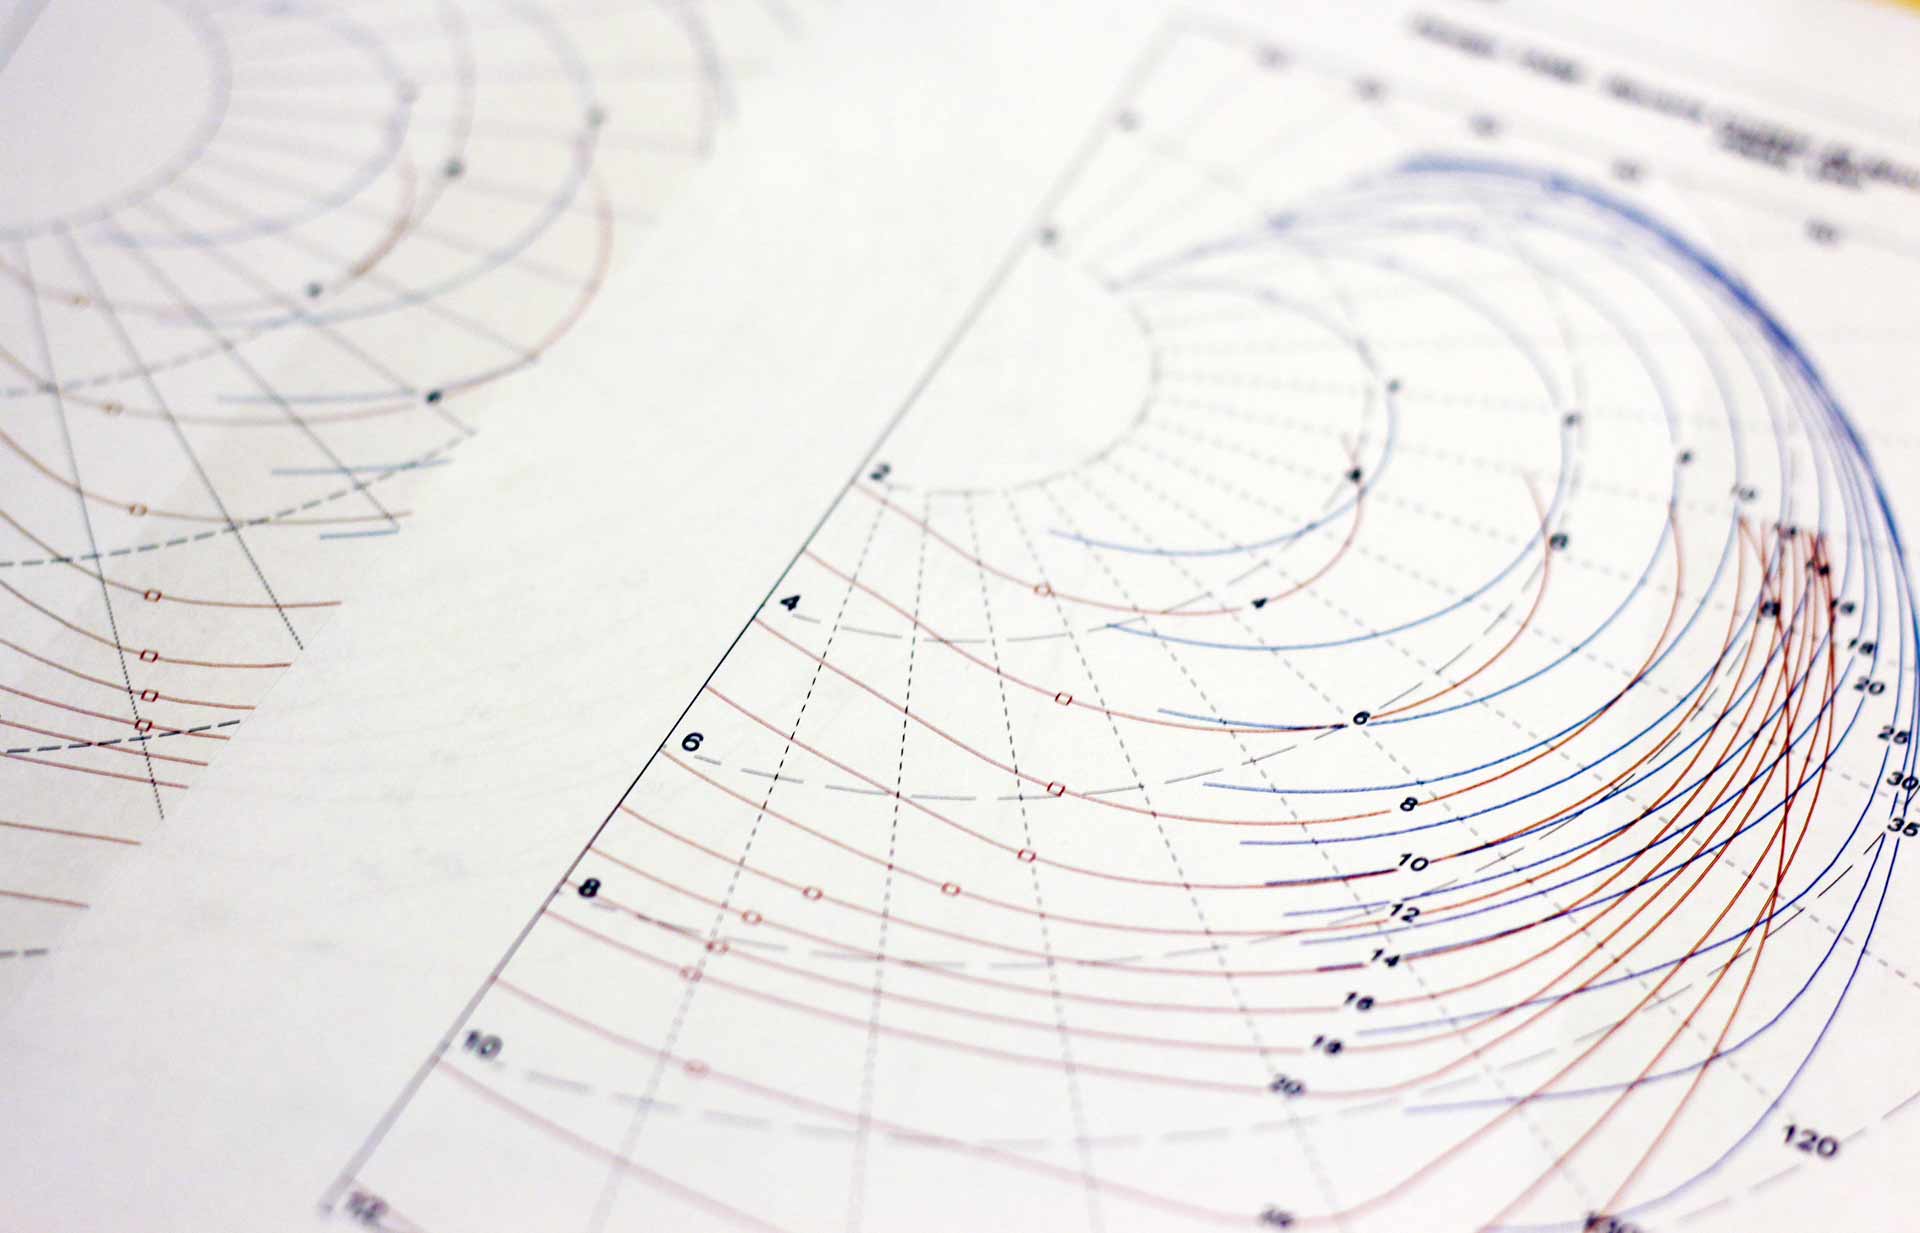
Peter is amused how people are always complaining and demanding such diagrams but few of them would be capable of understanding what they mean. “That´s a pity with some people are asking for these diagrams but they do not even have a profound knowledge of what such a graphic means.” Which is ridiculous because in principle reading a polardiagram is a no-brainer: The circle at the outside marks the angle to the course of the boat which is virtually situated in the middle of the diagram. The angle tells the direction of where the true wind is blowing. Starting in the middle and concentrically moving outwards are circles marking the speed of the boat – as it is the case for my diagrams, its 4, 6, 8 and for the Cruiser 41 S up to 12 knots of speed.
Reading the diagram is easy: You follow the colored graph for a particular wind speed from 4 to (again with the C 41 S) 35 knots and you may now determine the boat´s speed for every true wind angle and look for the best possible angle to trim the sails and steer the boat. The polardiagram offers graphs for both upwind and downwind-sailing. “To cut it short: A polardiagram provides a clues over tacking-angles and the theoretical potential for the speed of a boat.”, Peter explains. Yet at the same time he warns to over interprete the data: “To my mind, only the graph of the upwind-performance is of real use here. Why? Because upwind-sails are set. They are specific and mostly unchanged. That´s completely different when it comes to sailing before the wind. Which spinnaker do you use? Code Zero? Or a Gennaker, large Genoa? The set of sails utilized for downwind-sailing is such an individual thing that a skipper should not rely on a boat builder´s polardiagram for his particular boat – downwind-wise.” Besides, everybody knows that the most effective sail trim whilst down the wind is between 135 and 140 degrees – you don´t need a computer-based diagram to tell you that.
I´ve got three different Polardiagrams – of one specific Boat
So we do only look at the upwind-performance. “Looking at these graphs, there´s in my opinion only one interesting part to be acknowledged here: These tiny little squared markings on the upper side of the performance-lines.”, Peter explains: “Because that is what should really be of interest for you as a skipper: The marks are telling you of how close you may get to the wind. When sailing upwind this is the Million Dollar Question indeed. How close can you get before sails start breaking down?” And here I do understand at last where a polardiagram makes sense at all: Whilst the C 41 SK and DK allow a skipper to bring the ship upwind no closer than 40 to 43 degree to the wind an C 41 S can go much farther, sometimes clea-cut below 38 degrees. “And here is what makes a different when on a tack or racing upwind during a regatta.” One may find these little marks on the lines for downwind-sailing as well, figuring out of how deep one may go before sails will kill. I begin to understand, everything makes sense.
Beware: Polardiagram is not Polardiagram!
Peter warns to take every polardiagram for granted. As it is with every statistical data one would ask prior to reading and interpreting the graphs how the data has been comprised and how. On the VPP by Farr Yacht Design I can see a small sentence at the bottom of every page: “Wind values at masthead height. Roug water.” And the “rough” is the main thing here: “Again and again I witness diagrams of boat-builders which have been apparently made to help the sales department and marketing people instead of providing for real data with practical use. That makes me angry once in a while because they do calculate their VPPs not n rough seas but for totally made up conditions: 30 knots true wind speed and a sea like a mirror without any waves at all. But can that data be trusted? Certainly not! Worse: These graphics do mislead a dedicated skipper and would-be client.” Bavaria opted to go for real-life “shitty” weather conditions as experienced mostly by skippers out on the water. “With winds and waves and everything: This is what we think we do owe to our clients because this is what awaits them out there off shore.”
Only the Upwind-Performance is of interest here
Peter has warm words for Hallberg-Rassy in this case (of which I had the pleasure to have a thorough inspection of the HR 412 and 43 – here´s the complete article). Hallberg raises its data for rough sea conditions as well: “You will get the true picture here, not the perfect sunny snapshot of paradise-sailing. Even and because this is just a simulation, it´s better to have data to be trusted. Some brands are running simulations for the 1 per cent of a lifetime dream-conditions making their product appear just perfect. But anyway, if an owner just wants to jump from marina to marina with engine-power and has his priorities set on the size of the freezer for cocktail ice cubes … may it be.” He says, Bavaria has a different approach here: “Our boats ae not trendy. We do put a great effort on well built, seaworthy yachts. We want a stable and solid hull – not fashion. Our ships should be sailing well-tempered and be reliable over all. And that’s meant for heavy weather as well.” Between the poles Beneteau and Pogo a Bavaria yacht is the exact middle, Peter emphasizes: A seaworthy, reliable cruiser.
Makes more Sense for the practical Skipper: Best Boatspeeds-Table
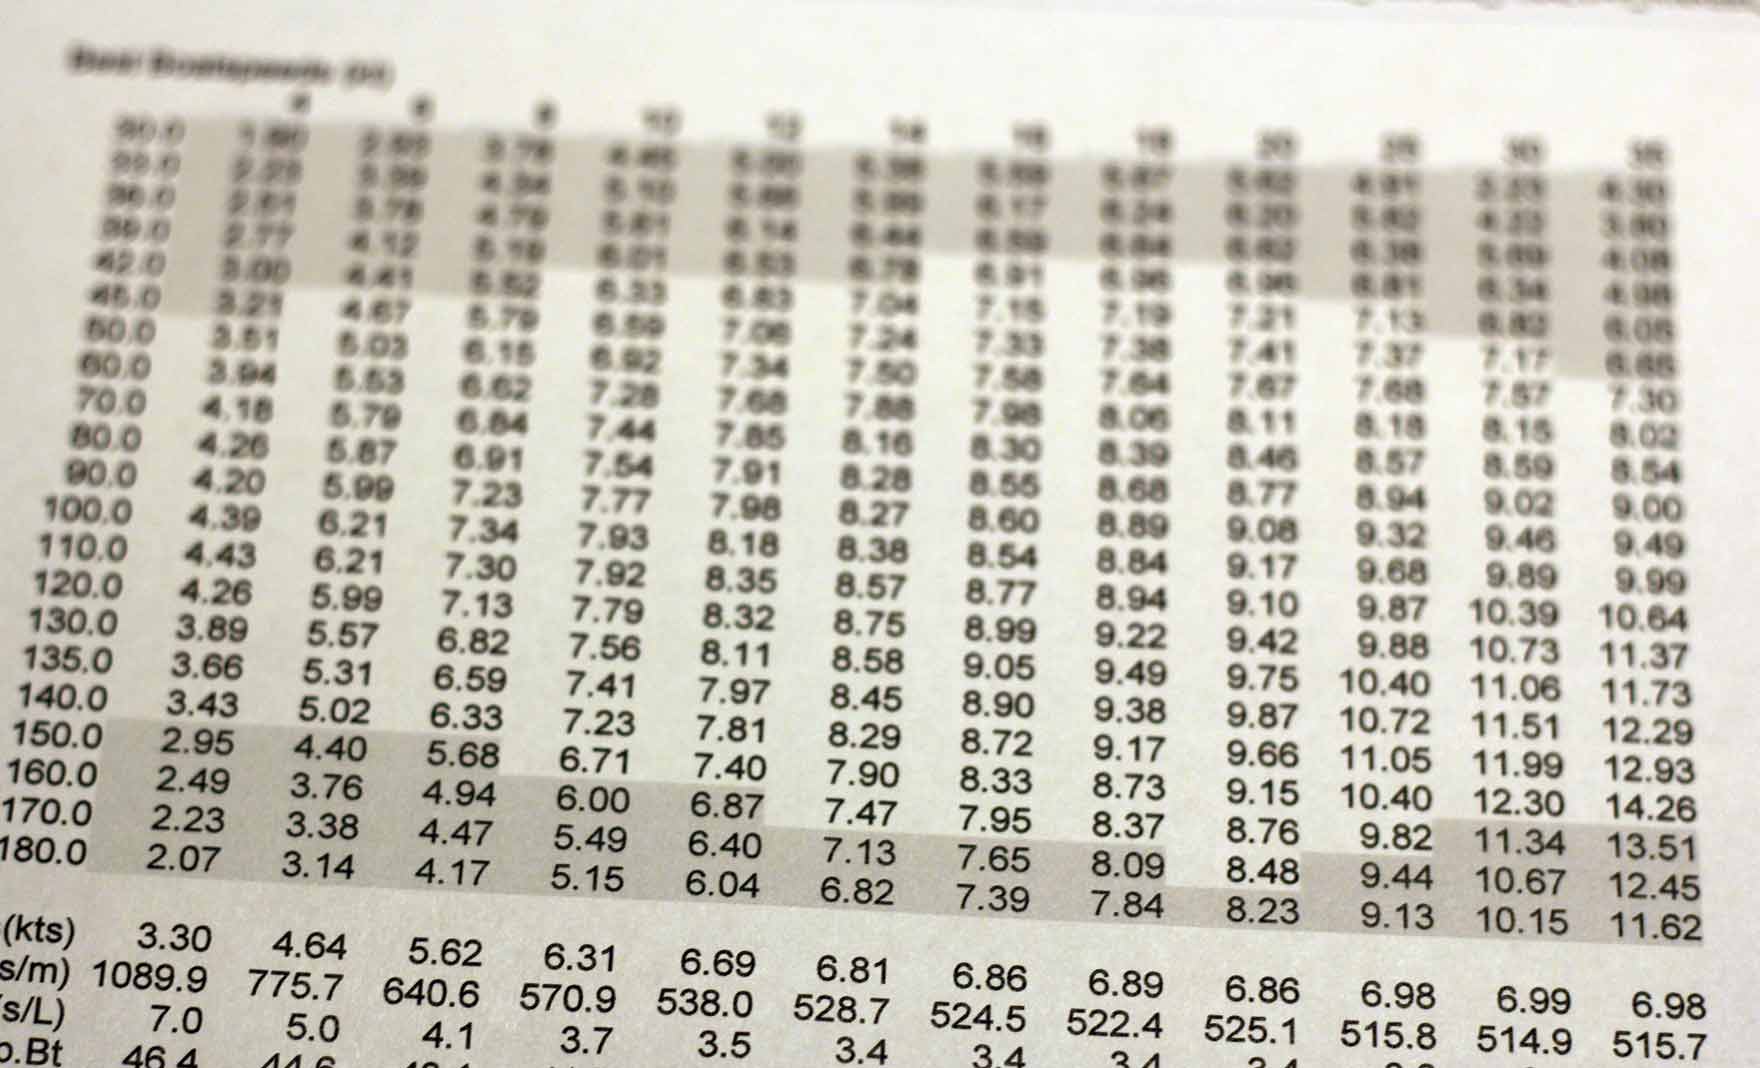
Peter has another interesting aspect and points towards a different thing: “You know what has much more practical use than the polardiagram? The Best Boatspeeds-table. You may find this calculation some pages after the diagram. A skipper should go forward and always ask for such a graph instead of the polardiagram in the first place because there is much more useful and practical information in this.” I am skipping through the pages and look at the data.
It is a rather simple matrix indeed: The x-axis comprises the true wind speeds in knots again, on the y-axis there´s the angle to the wind. Crossing the two axis for the wind speed one can determine the best boatspeed. “This graph is the nuts and bolts of a performance sailor.”, says Peter: “If you look at pictures from let´s say the Volvo Ocean Race or other big regattas you may occasionally spot these table pinned to the rear of the cockpits. This is the Holy Bible of sailing trim – following these data a trimmer will adjust his sails to optimize the boat´s performance to the tenth of a knot. Onboard they do have 6 or more of these graphs – each for every different sail. This is really exciting, isn´t it?”
This is of real interest: A Skipper should always ask for the Best Boatspeeds-table
I do understand: There is one specific trim for every wind speed that will produce the most speed for the boat. “Exactly! As long as you do not have your sails adjusted to these grey marked areas, everything is fine. With cruising. But whilst in a race, you would start to trim your sail to squeeze every bit of performance out of it.” I can see: For the C 41 S and lousy 4 knots of windspeed, the optimum can be 0,7 knots faster than the average – at 30 knots windspeed the difference goes up as high as 5 knots! This is how you win a race. Or lose it. (Speaking of high-performance sailing – I´ve had the pleasure to talk to Tim Kröger, one of Germany´s leading pro skippers, read the full interview here)
Advertisement
My Conclusion: Polardiagrams can help with deciding which yacht to buy
In the end I am somewhat astute than before. I now know how to read and understand a polardiagram and where the tripping hazard may be. A polardiagram can, when it´s data have been raised on an assumption of “true” conditions, be of great help for a dedicated would-be owner choosing between boats. It can deliver hints on the character and performance of a sailing yacht. But one shouldn´t overestimate the value of such a graph: “They are just simulations. Their comparability is in question to my mind and that’s why you definitely shouldn´t skip thorough sea trials and practical sailing on the yacht of desire. Just go for the upwind-performance because that is from my point of view the one and only practical and authoritative information to be drawn of a polardiagram.” Peter nods when I do mention the fact that if somebody is going to spend 200.000 or more Euros on a ship he should take into account every data possibly available – including polardiagrams.
May be helpful with YOUR next yacht purchase – a thorough polardiagram
It´s an exciting and interesting new world for me. What a pity I personally do not have 200.000 Euros at hand right now or – more realistically – a best boatspeeds-calculation for my own King´s Cruiser 33. But on the other hand, for my own sailing yacht I do have plenty of other things to be concerned of than getting into the best possible sail trim …
Many thanks to Peter Meyer and Bavaria for taking time to answering a lubber´s questions with referring to their wonderful Bavaria Cruiser 41.