There is supposedly no other task in sailing more enjoyable and important at the same time than passage planning – deciding times for a skipper, because he has to make decisions as to when and exactly where to go. Avoiding zones of foul weather, strong winds, hazardous waves, yet sailing in zones with fair winds to bring the yacht from A to B the fastest and safest possible way. That´s the art of routing a boat, a thousand of years old science. He who was capable of this sorcery earned the respect and admiration of his fellow crew mates and could make a fortune out of it.
This has not changed in our modern times much, I´ll have to say. Regarding the respect. Still there is some magic to the field of navigation and members of crews sailing out are still looking up to the one who is sitting bent of charts and (mostly) over screen and keyboard of the laptop, trying out different sets of data to achieve the best outcome and get the best possible route. But where, when and why did this science evolve? Let´s dash into the past for a quick recollection of historical facts. Back then dating back as far as to the sixth century in the Mediterranean, thousands of ships began to make regular records of their voyages – the log book was born. When people learned to take the exact time with them in the 17th Century the young American and the British admiralty gathered these data and started something we would today call data-mining. Are there patterns to in weather, wind, drift and precipitation? And yes, there were!

The Admiralty Charts where born: For more and more areas of the world Captains where handed charts showing the predominant wind directions and forces of the prevailing winds for any given month of the year. Over time, the charts became more accurate, finally covering the whole world. These charts enabled the Captains to plan their voyages ahead and seek the best possible route for any time of the year in any area of the world. Those charts are of great value still today and a lot of skippers would utilize them to have a sailing trip planned and draw information from them. One should not forget that it was the combination of the chronometer and the compendium of sailing directions which enabled the British Empire to ascent to be the Ruler of the Seas in the first place. Nowadays the Sailing Directions as books are as popular as ever but a new technique is emerging faster and faster, more and more replacing the old art of navigation: Computers, software and the Internet.
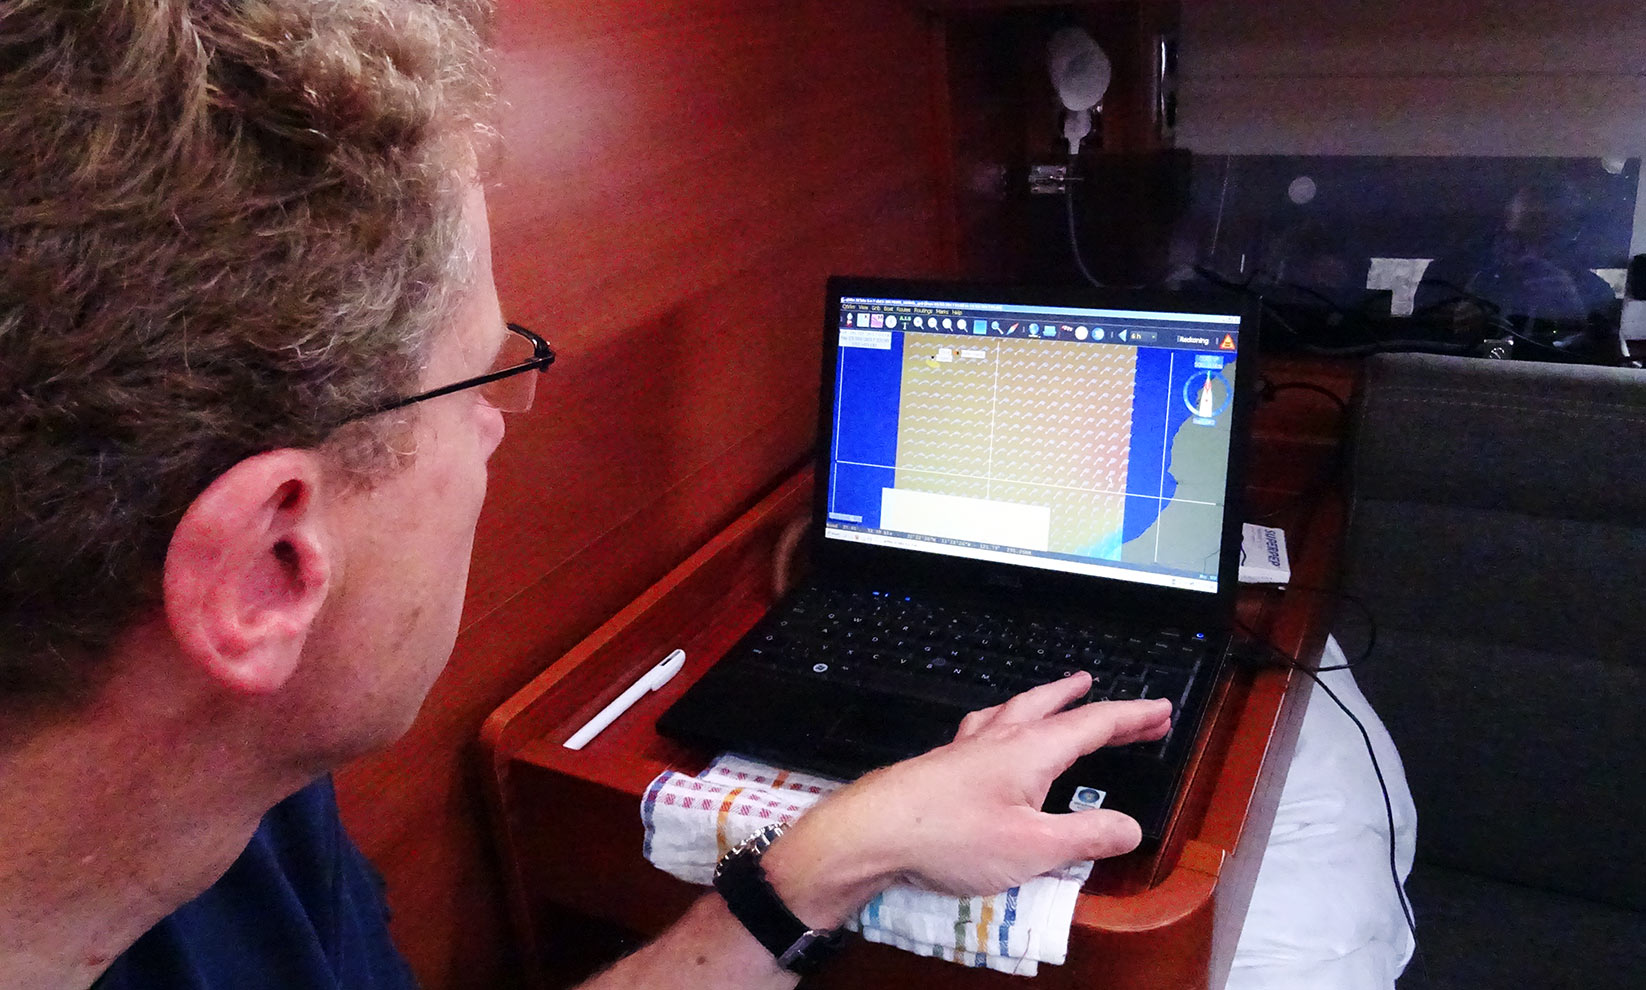
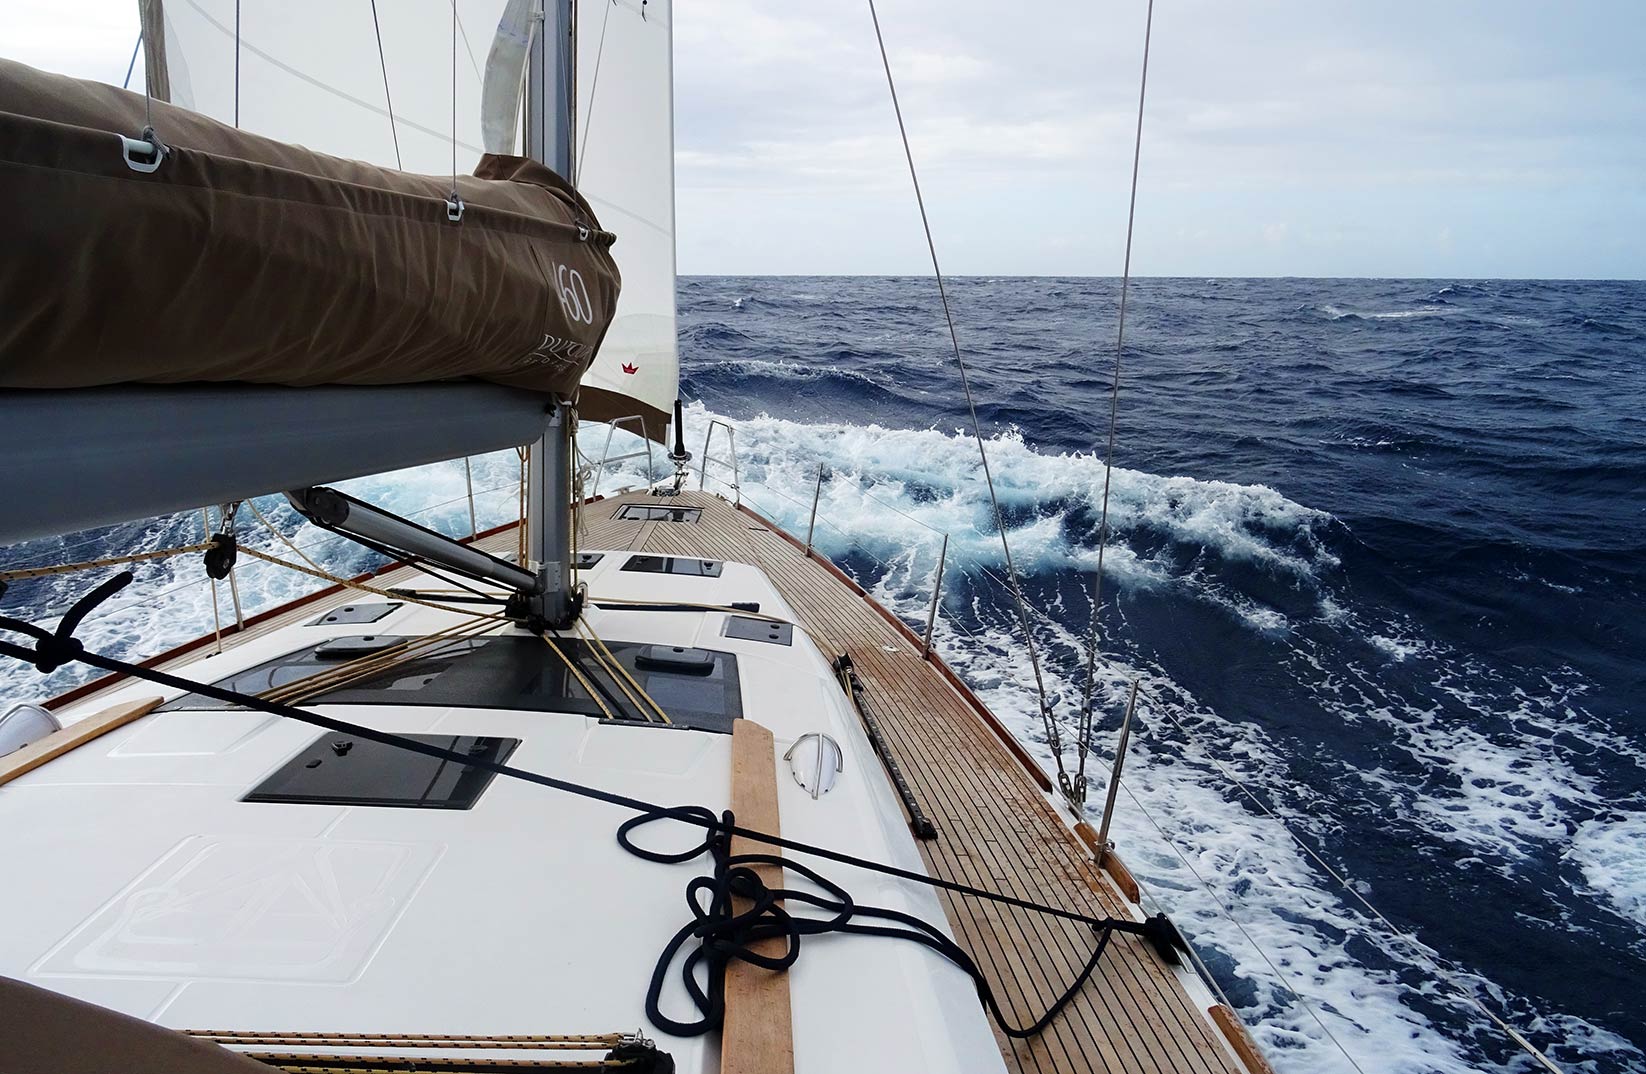
When I went on the 1.000 miles sailing trip from Lisbon to Lanzarote some weeks ago (read all about the trip here) we´ve had a crew member who was setting up his laptop on the chart table with permanent GPS-connection and NMEA-connectivity to the boat´s chart plotting system. He ran programs that have been doing the old art of navigation: Comparing latest weather forecasts and seeking the fastest yet safest way to our destination. The programs are called ZyGRIB and qtVLm. I was so fascinated that I dived into this topic by myself after arriving back home. Here´s how you can utilize this technique for your own passage planning. Best thing: The programs are free of charge and very easy to use.
Getting forecast GRIB-data with ZyGrib

So, the first thing you need is the latest weather forecast for your sailing area, proposedly for the area between your starting point and the destination you are heading to. In former times all you´ve got have been the isobaric charts and clumsy forecast models. Today, that has changed – powerful supercomputers are calculating wind, precipitation, air pressure and a lot of other factors very precisely and have it all delivered to you very convenient. The kind of thing you are looking for is GRIB-data. GRIB means GRIdded Binary data. So, first thing to do is download the ZyGrib-program.

It´s for free and installation does take just minutes. Once you´ve downloaded, unpacked and installed this program, handling is very simply: As noted above, just encircle the desired sailing area with your cursor and start the download. The program will contact the server and get you the deserved GRIB-files in a matter of minutes (with stationary Internet-connection at home of course). A GRIB-file of the size of the Baltic Sea for example will have the size of 6 MB, for the example shown here in this article, the sailing area between the French port of Brest and the Azores encompasses 7 MB.
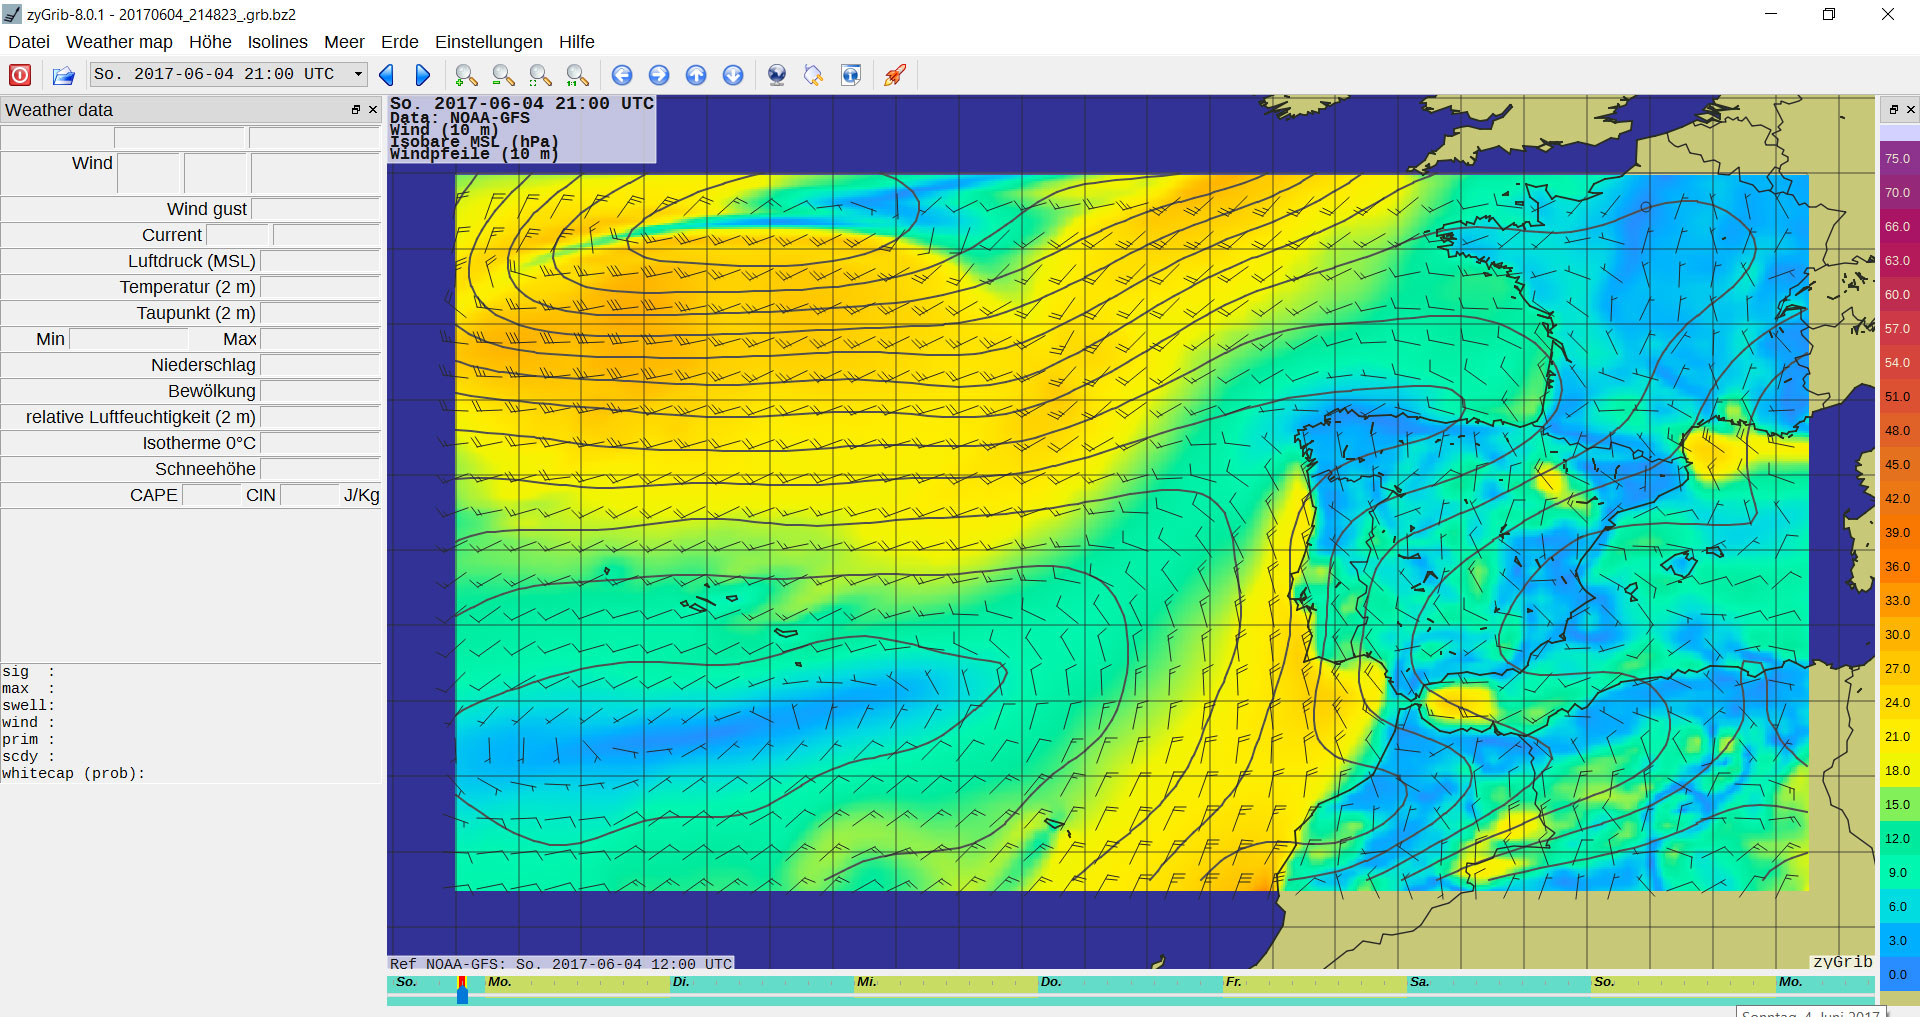
After downloading the file you may save it to a special folder – maybe right on the desktop – because you later need to access this file quickly from the second program. But let´s take a look at the GRIB file first. As you may notice instantly, the wind arrows will show the direction and strength of the wind in any given spot of the area. On the lowermost side of the chart on the x-axis you may see the actual forecast for the coming eight days. GRIB-files contain forecasts for the current plus 7 days. You may shift the cursor along the x-axis to watch the weather changing. Notice the Azores-High south of the archipelago?
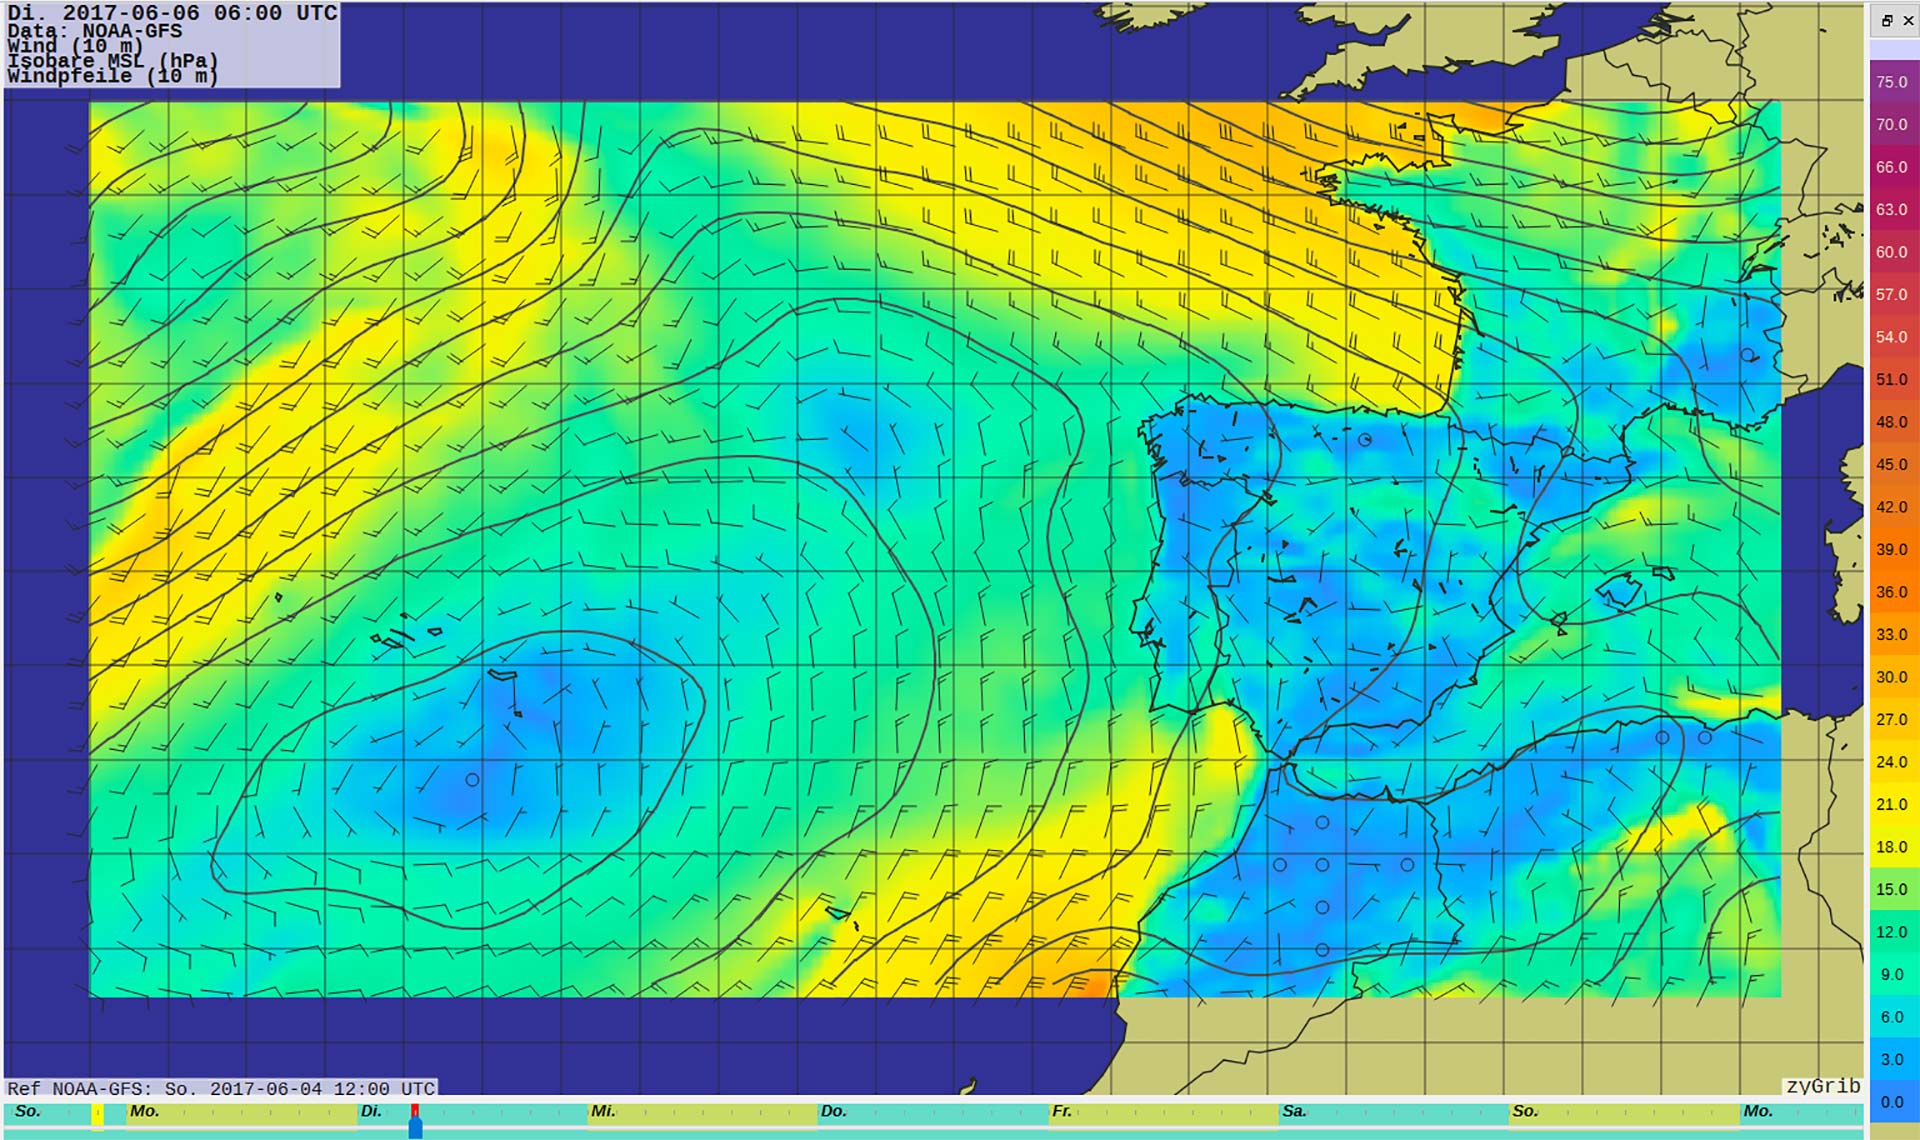
Of course you know that a weather forecast should only be trusted three days max into the future, but – as with our offshore example shown here – weather systems over sea are pretty stable and so it is may be valid to expand this trust a bit longer. But I would advise to download fresh GRIB-data every three days when sailing, even shorter intervals when sailing in foul weather conditions or in hazardous areas like the Southern Ocean. Also, if sailing near coast lines, a forecast may changes very rapid, so even the mentioned three-day-period may be too long for a stable and trustworthy forecast. The shown example is in the open Atlantic trade wind areas and therefore can be trusted three to five days in advance if no serious weather systems approach.
Sailing Passage Planning made easy
So, after acquiring latest weather information via GRIB download, you will need to download the second program, the very one that will do the actual weather routing. This program is called qtVLm and as I learned, it´s pronounced like “cute V L M” although you may call it as you like. Again, this software is for free and installation takes only minutes as it is a no-brainer. Open the program and first import the GRIB file from the folder you´ve created after the ZyGRIB download. You will see the designated area on the world map highlighted with the very GRIB data then. Zoom in.

Now, we assume we have a boat in the wonderful port of Brest and want to start a circumnavigation via the Azores: A classic route to take as done by hundreds of crews each year. You just simply press the right button of the mouse at the Brest position and choose “Move Boat Here”, and so it will be done. You´ve defined the starting point of your journey. There are several other options in this dialogue too, as to create marks, POIs or barriers which you may encounter in further details later, for the time being, “Move Boat Here” will perfectly do.

On the Azores we´ve chosen the port of Horta on the Island of Fajal as our destination, so you just zoom into the archipelago and the very island and – guessed it right – also do a right-button-click right when the cursor is near the very destination coordinates and define “Create Route” from the dialogue opening up. Now the magic happens. The software will now begin to instantly calculate the best route you may take from starting to end point in relation to the weather charts.

Beware: You can define the starting point with the cursor and right-button-click, but the very starting time is pre-set by the time-code of the GRIB-file you´ve downloaded. Unless you define the starting time within qtVLm by moving time forward into the forecast with the time-arrows in the upper area of the screen. That is why you should look thoroughly at the GRIB-data to seek the best time to leave departing port. Once ZyGRIB is installed and imported, qtVLm will download any new data for this area from the server directly without the need for you to open ZyGRIB again.

Now the desired routing is completed and you may be surprised what you see: Possibly not a straight line. In my case, a zig-zag course with no less than five tacks and a couple of gybes. Calculation accuracy can be altered too. qtVLm offers quite a lot of correction modes which can help you to either save time by allowing the program to calculate a more rough route (by altering the GRIB time frames between each calculation step, or a very detailed route, which will significantly increwse calculation time to some minutes. You may for example let the software calculate in 6 hour-steps or in 30 minute-intervals) and many more other settings. Just try out.
Amazing – this is Weather Routing at its best!
When I look at the suggested route for Brest-Horta the amazing work of this program will be visible. By pushing the “Play” button I can now watch my boat leaving Brest, crossing the Bay of Biscay and making her way down south to the Azores. As times goes by – depending on the time-frame-setting – I will see that my boat is always routed on the best possible point of sail regarding the given wind situations according to the forecast. Amazing!

In this case, the program routes my boat in a way so that we would always be on a beam reach as this is the best course in terms of speed and comfort for my boat. And if I´d be honest: I would never have been able to plot a route this accurate manually! The program even emulates daytime and night-time so that a skipper with qtVLm up and running during the sailing trip can brief the watches on upcoming weather conditions visually, can help to prepare the shifts for tacks and gybes, increasing or decreasing wind forces.

The visualization pattern also provides helpful data to locate no-go areas like approaching gale-force wind fields, foul weather regions and regions of calm winds. In sailing it is not uncommon that only a handful of miles can determine having fair winds or no wind at all. By visualizing this in a colourful, animated way with time reference a skipper and his crew will understand weather conditions and the broader weather systems creating those conditions more rapidly and profoundly. This is what makes qtVLm a very, very helpful tool for the ocean passagemaker.

In my acample, I´ll arrive after a very fast less than 6 day sailing trip. The numbers could be seen in the dialogue “Statistics”: I´ve made 1.400 miles of sailing to the Azores which is flat 300 miles more than just the straight line would have been. 300 miles, that´s nearly 30 per cent more sailing distance than the straight line. I didn´t managed to check the sailing time for this straight course, but I am sure this straight course would have brought my boat into calms, gales and above all into many more gybes and tacks.
Finetuning your qtVLm-Software
Under 6 days to the Azores? Are you on a racing yacht? That´s actually true – I chose the Cigale 14 to be my yacht to race to Horta. And this is another great point in qtVLm software is the finetuning aspect. This is not a “can”, but a “must”. qtVLm was originally developed for racing navigators to predict best possible routes in a regatta. Therefore the program must “know” the data of the yachts. qtVLm has a number of pre-set yachts you can choose from, most of them are of course racing yachts like the Class 40. If you do not happen to the lucky owner of a Class 40 racer, you may apply manual changes to the boat´s settings.

You can either enter the principal dimensions of your very own yacht in a form: Putting in length, draft and other data you may near the qtVLm yacht used for calculating the routes to your own yacht. You can also upload the polar diagram of your yacht, which I would assume is available for nearly every sailing yacht out there no matter which brand, size or building year. At least the more recent yachts should have a polar available. The format is a CSV file and should be provided by your dealer of the yard itself.

You can also put in variations like “avoid wave heights of more than …” or “Use engine if wind speed drops to …” and set – as I mentioned – barriers into the chart, like Navy practicing grounds of which there are many restricted areas in the Baltic Sea for example. You may also set POIs to represent a regatta-course to letting the program calculate not just the best possible route from A to B but from A to B to C to D … The limits of qtVLm are virtually non-existent as this this program may exceed the ordinary skipper´s demands for plotting a route for the next sailing trip.

Weather Routing: The Non Plus Ultra?
Now, is qtVLM (and the other weather routing software programs) the new non plus ultra? Well, first of all weather routing is a very fascinating and of course very helpful tool for planning your voyage. Even if you do not really plan a route, the mere visualization of GRIP weather data helps a great deal to understand weather systems and help memorize sailing conditions far better than looking at a static isobaric chart. Like any other tool, weather routing is a tool with which you´ve got to learn – and to learn about its strengths and limitations. I found planning shorter routes – for example in the North Sea or Baltic Sea – rather pointless. Distances are simply too short, sailing area too small. But in planning my next Atlantic Ocean experience … qtVLm will be part of the plotting process for sure!
Other interesting articles on that topic
Good old fashioned sailing trip planning
Harbour hustle – learning to navigate by night
Polar Diagrams: What they mean and how to read them